In a previous post, I wrote about Hayek’s claim that capitalism reduces economic inequality. Milton Friedman makes the same claim about capitalism and inequality in “Free to Choose.” This claim was quite plausible in the early 70s, less so today. There’s an irony here, which is that the data upon which Friedman and Hayek relied to show that capitalism reduced or didn’t exacerbate inequality were taken primarily from the post-war period of strong unions and active government, the very economic phenomena they were trying to curtail.
Anyway, even if they’re wrong about inequality, Hayek and Friedman can still claim that capitalism benefits the poor – the claim taken up recently by so-callled bleeding-heart libertarians such as John Tomasi and Jason Brennan. Here’s Friedman, from Free to Choose:
The main bit:
“I do not know any exception to the proposition, that if you compare like with like, the freer the system, the better off the ordinary poor people have been.”
Is that true?
Inspired by Friedman, the Fraser Institute started to measure economic freedom across the globe, and to relate such freedom to other economic variables, such as the income level of the worst off. In their 2015 Annual report, they provide this table that describes the relationship between economic freedom and the economic fortunes of the worst off, across the globe:

The freer a country is, in economic terms, the higher the income of the country’s poorest citizens.
What do the data themselves look like? Here’s a graph I did for 2005 – I chose an earlier year because there isn’t data for every country for each year, so I wanted to be able to use data from an earlier or later year, whichever was closest. The measure of income is from the World Bank’s Development Indicators.
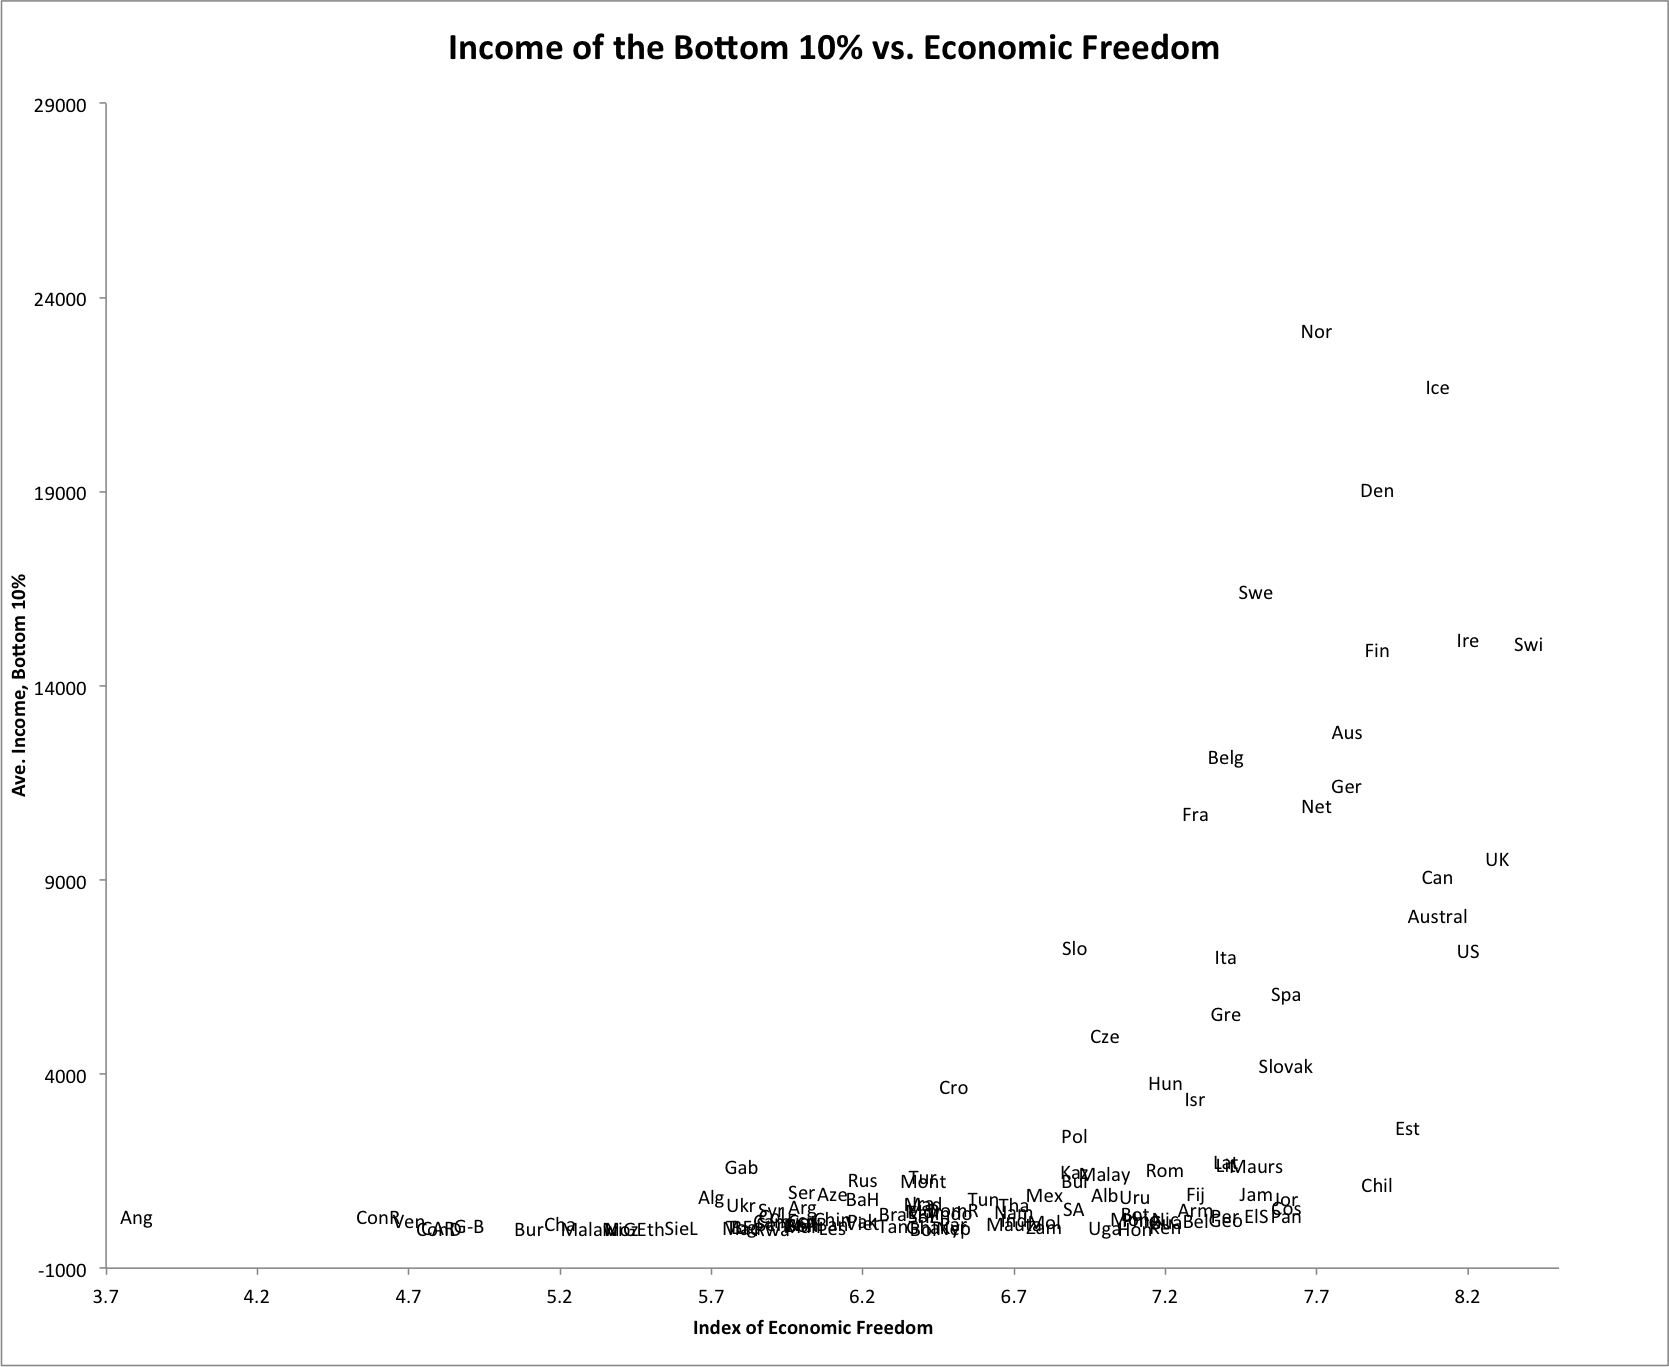
So there is an association – and if you’re prepared to consider a curve as opposed to a straight line, then past some mid-level of economic freedom the income of the bottom 10% takes off!
However, one thing that leaps out (well, it would leap out if the data points weren’t so close together, and if my country labels weren’t idiosyncratic) is that the bottom tail is composed of very poor countries, countries that do poorly on economic freedom because they also have weak rule of law (protection of property rights). For example, here are the countries with the lowest economic freedom rating, along with their component ratings on “Legal System and Protection of Property Rights” for 2005 (max score = 10)
Angola – legal / property score = 3.15
Congo (Republic) – legal / property score = 2.35
Venezuela – legal / property score = 2.77
Central African Republic = 2.81
Congo (Dem. Repub.) = 1.75
By way of contrast, Canada scored an 8.08 on legal / property rights in 2005.
There is no doubt in my mind that the impartial, predictable enforcement of known property rights is a component of economic freedom. Security of property rights goes along with rule of law, and and rule of law I presume is a key factor that explains economic growth. But the fact that rule of law raises up the worst off is not necessarily a reason for thinking that shrinking government is good for the poor, or that reducing regulation is good for the poor. These are some of the other components of the Economic Freedom of the World Index (along with openness to trade and low inflation / convertible currency). It might be that rule of law is essential to growth and raising up the worst off, but that once some level of legal and economic development is attained, government spending is good for the poor. So let’s look at the top part of the chart. I more or less arbitrarily truncated at $8000 per capita GDP (this is all quite rough, I admit):
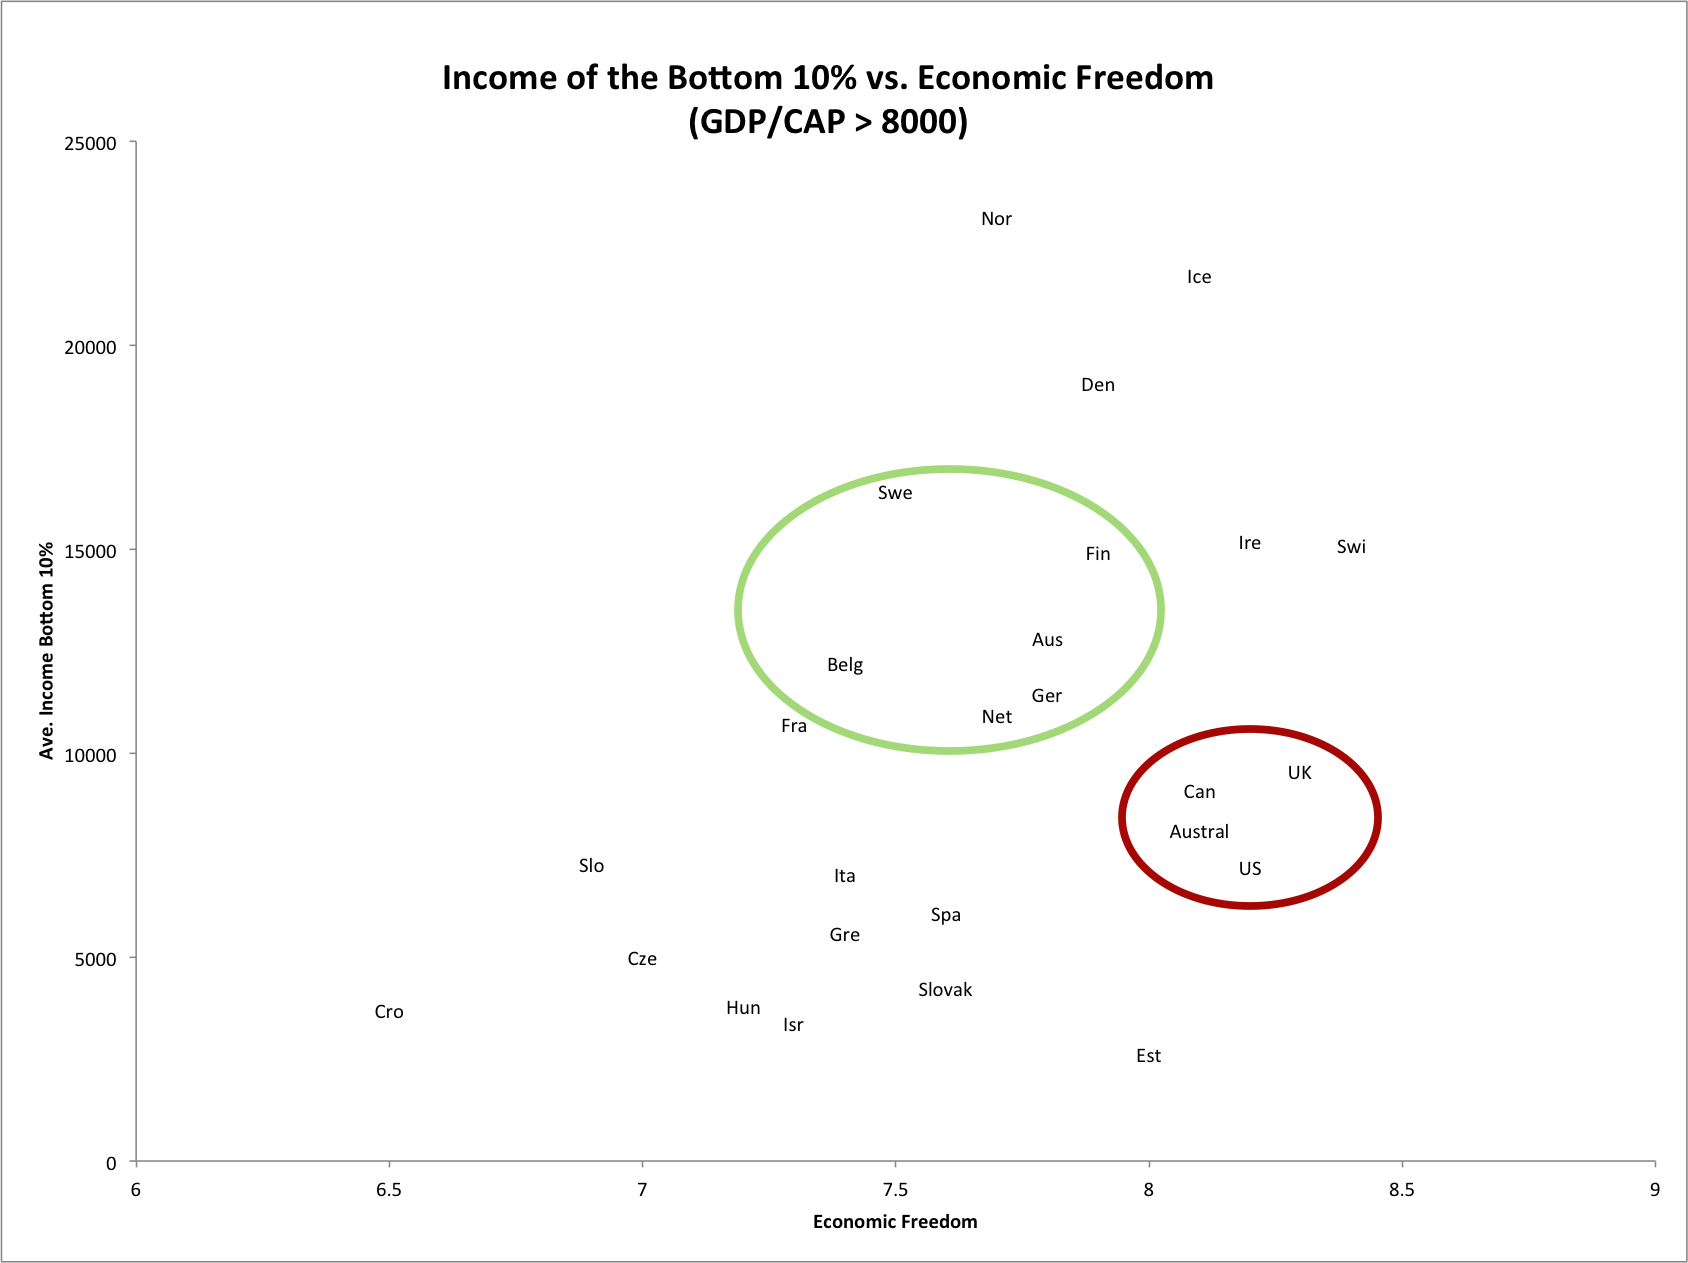
Clearly I should have truncated a bit higher to get rid of troublesome Croatia and Slovenia, which are threatening to give a positive slope. To compensate, I’ve very subtly circled in GREEN Sweden et al, and in RED the anglo-saxon countries. The point is that if one thinks that these countries are the ones that are truly comparable, it looks like more economic freedom is associated with the worst off doing worse, in absolute terms. (I think the main story here is that the countries in green, while being highly open to trade, have larger shares of their economies going through the hands of government. Will Wilkinson has recently suggested that it may be in part because citizens there are more protected from the ups and downs of the market economy that they are willing to tolerate such openness to foreign competition. If I’m not mistaken this is essentially Geoffrey Garrett’s thesis,in Partisan Politics in the Global Economy).
There are lots of complexities here, in the data, and in the inferences we might want to make about causal mechanisms, but as this is the second post in one day, I will leave it at that.
